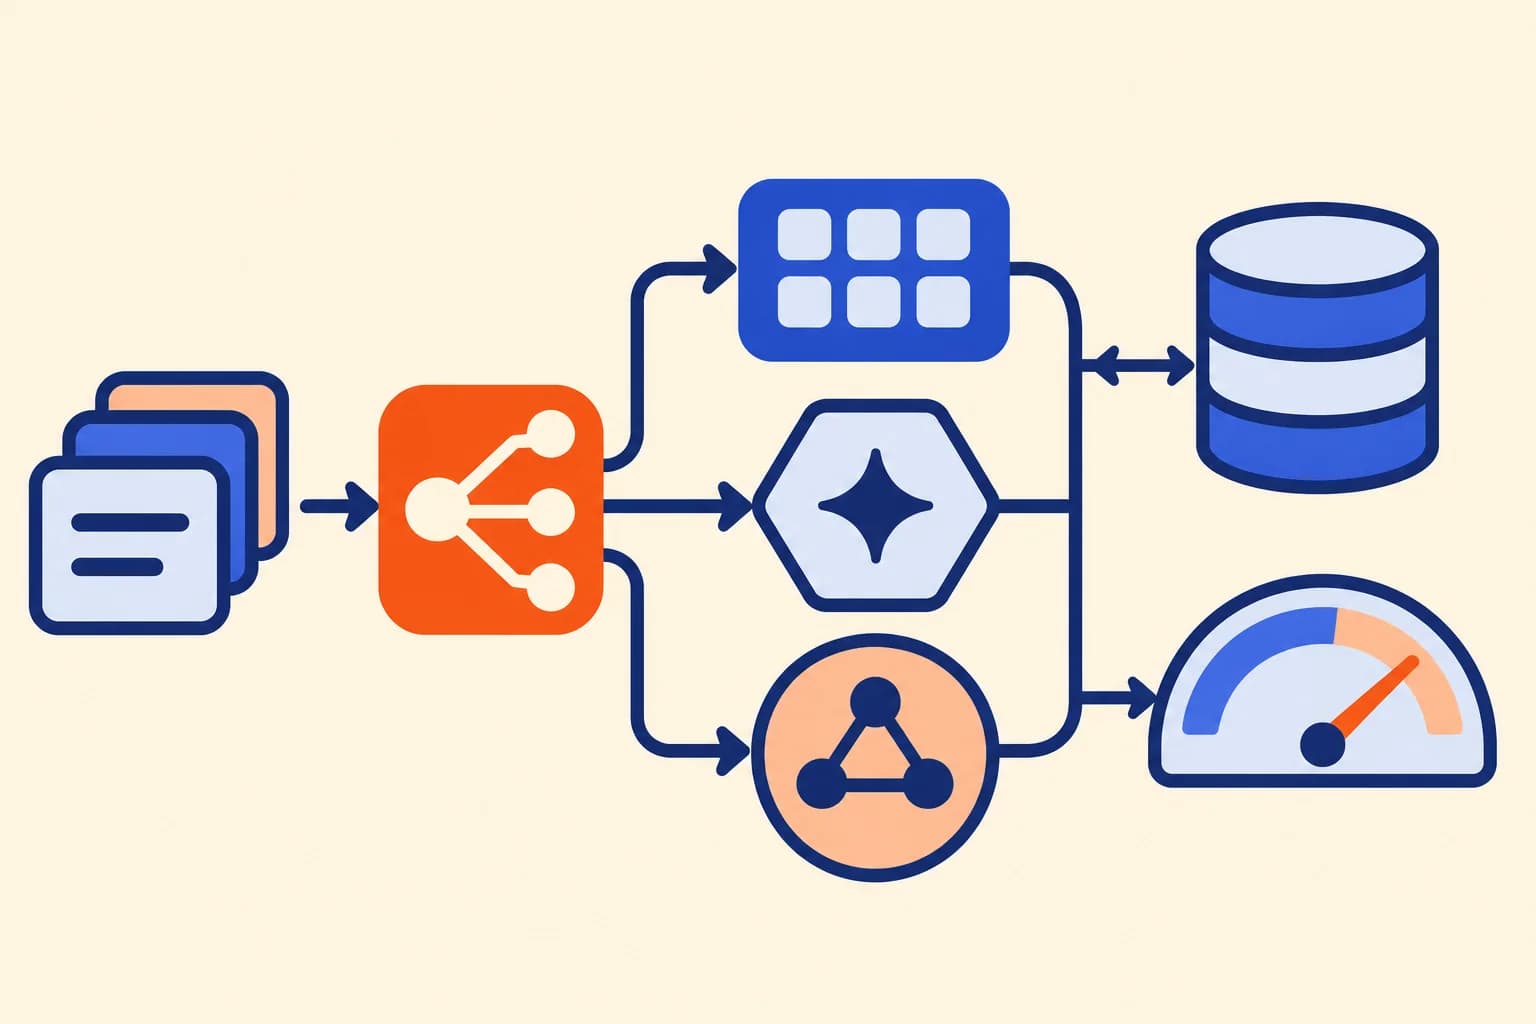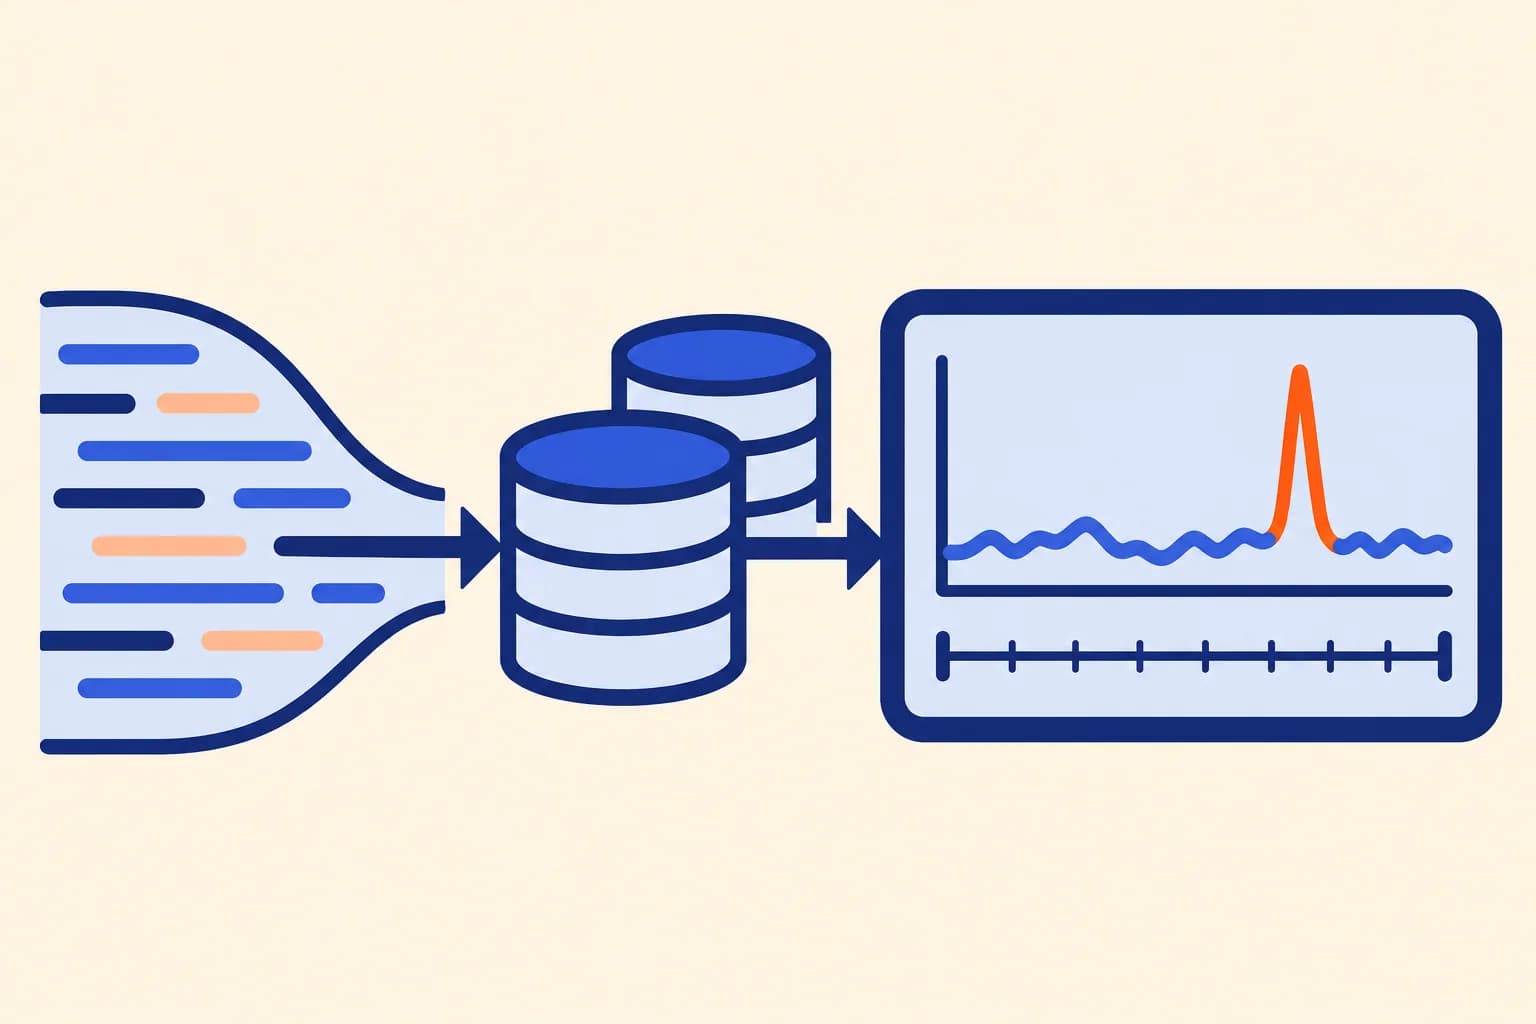
CDN logs can produce millions of lines a day. Making them useful requires deciding what to ingest, how to retain it, and which questions the dashboard will answer. Across two large-publisher projects, we have worked on download pipelines, filtering, Loki, Grafana, and daily aggregation. Their value lies in connecting operational diagnosis with knowledge of the published archive.
Volume needs units and scope
A sizing reference for the first project states approximately 33 million raw lines per day. The documentation does not provide a dated daily snapshot for that estimate: we use it as a design reference, not as a current measurement. In the second project, a September 2026 runbook describes daily processing of roughly 7.1 million main-host lines queried from Loki, after its filtering policy.
Those figures are not comparable as total traffic: one represents estimated raw input, the other the lines available in a filtered system. Nor are they unique URLs, users, or gigabytes. Each installation's acceptance criteria fix the day, time zone, hosts, and layers in order to reconcile downloaded files, lines read, exclusions, and lines submitted.
Filter without losing the problem
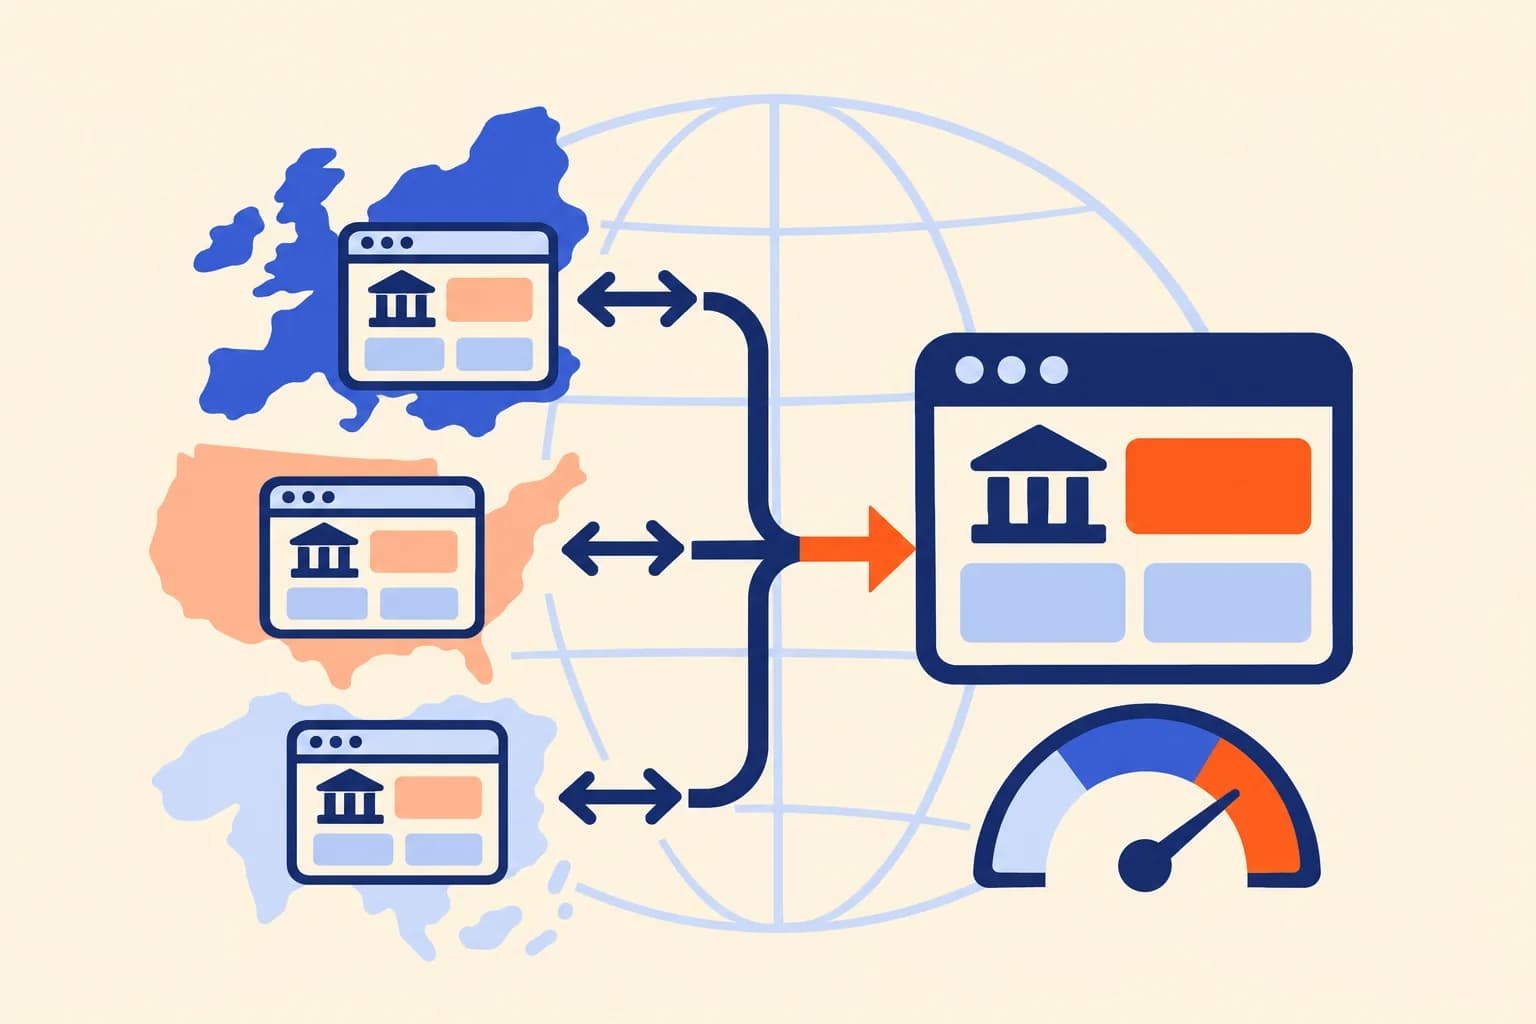
The pipeline extracts time, host, path, response, and user agent. We preserve bot signals and relevant errors. Filters are tested with samples that include failed resources and page fragments. In a layered CDN, one request can appear at the edge and at an internal node: counting both without distinguishing them duplicates activity. The purpose and the exclusions are documented.
Loki labels keep cardinality under control. The full URL is queried from the line content where appropriate; turning every address into a label can change the cost and behavior of the system.
Fast dashboards, durable history
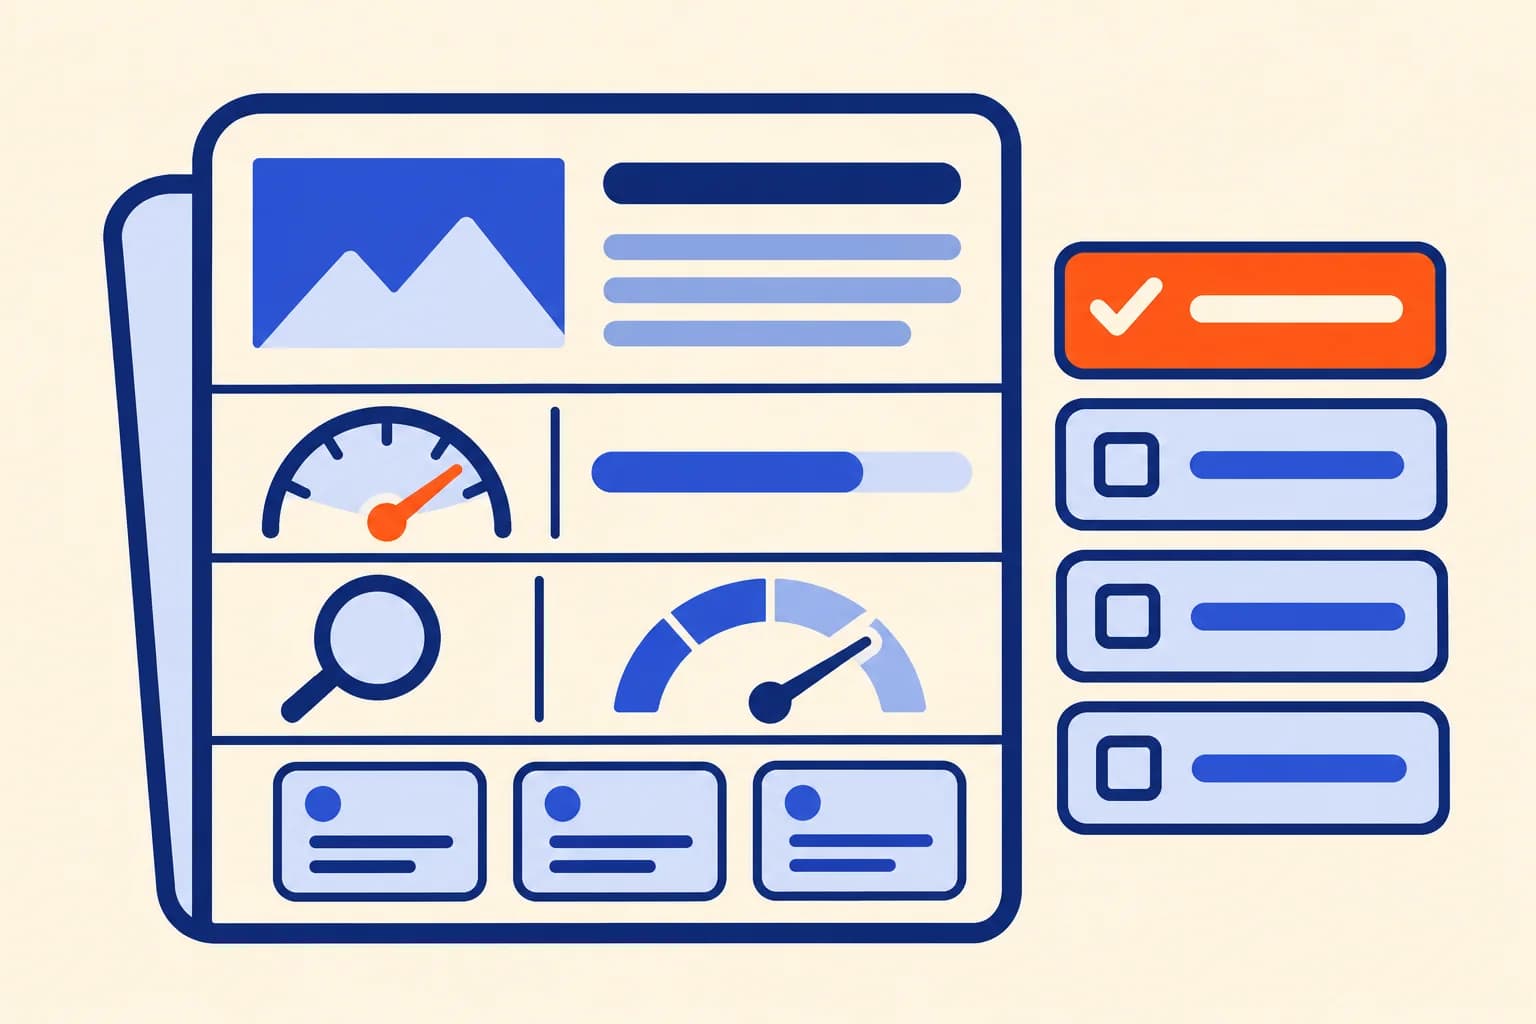
Grafana organizes responses, bots, errors, and trends with verified queries and aggregations. Limited log retention is supplemented by daily summaries and a discovery census. Aggregates preserve history without treating a thirty-day dashboard as a permanent archive.
Controls check gaps, duplicates, limits, and ingestion progress. Queries are reviewed to avoid overlapping windows. Storage and cleanup follow the agreed retention and respect the shared resources of the server.
Connect observations to decisions
Joining the logs with the CMS, the sitemaps, and search engines makes it possible to investigate unknown pages, errors, and crawl changes. A bot requesting a URL does not prove that it is indexed; a spike in image errors does not equal lost articles. We deliver dashboards, methodology, controls, and operations so the team can interpret the data and act on verifiable causes.