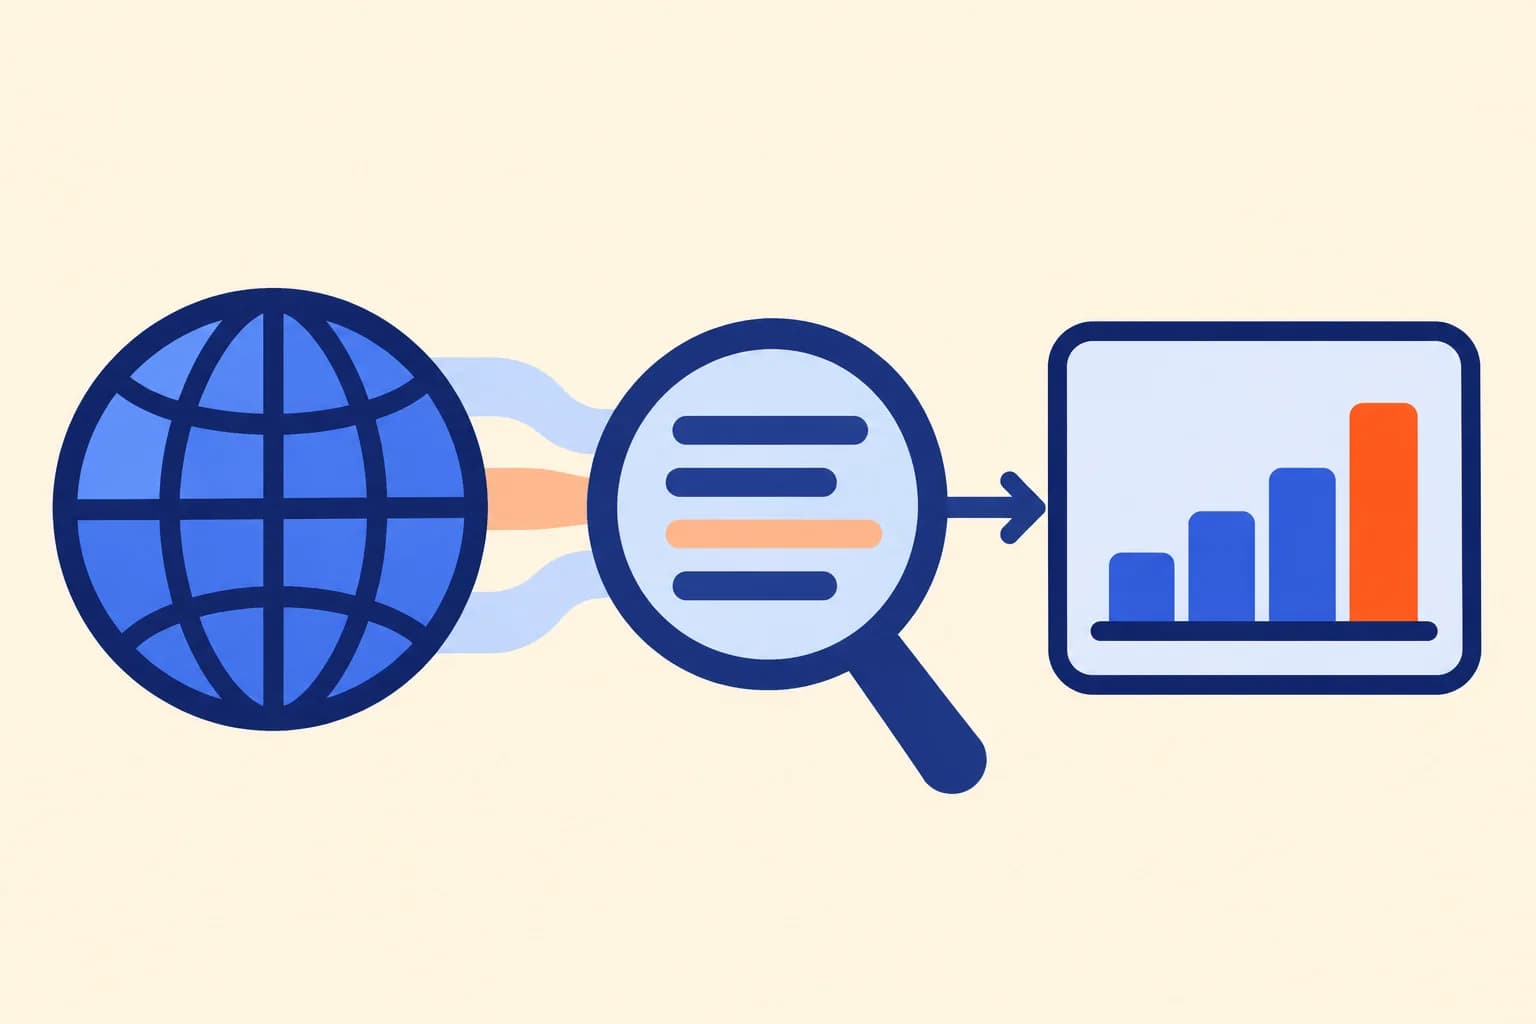
Crawling tools show what your own crawler can discover. CDN logs show what bots actually requested and how the site responded. That difference is especially useful when reviewing a migration, an outage, or indexing changes.
Prepare the signal
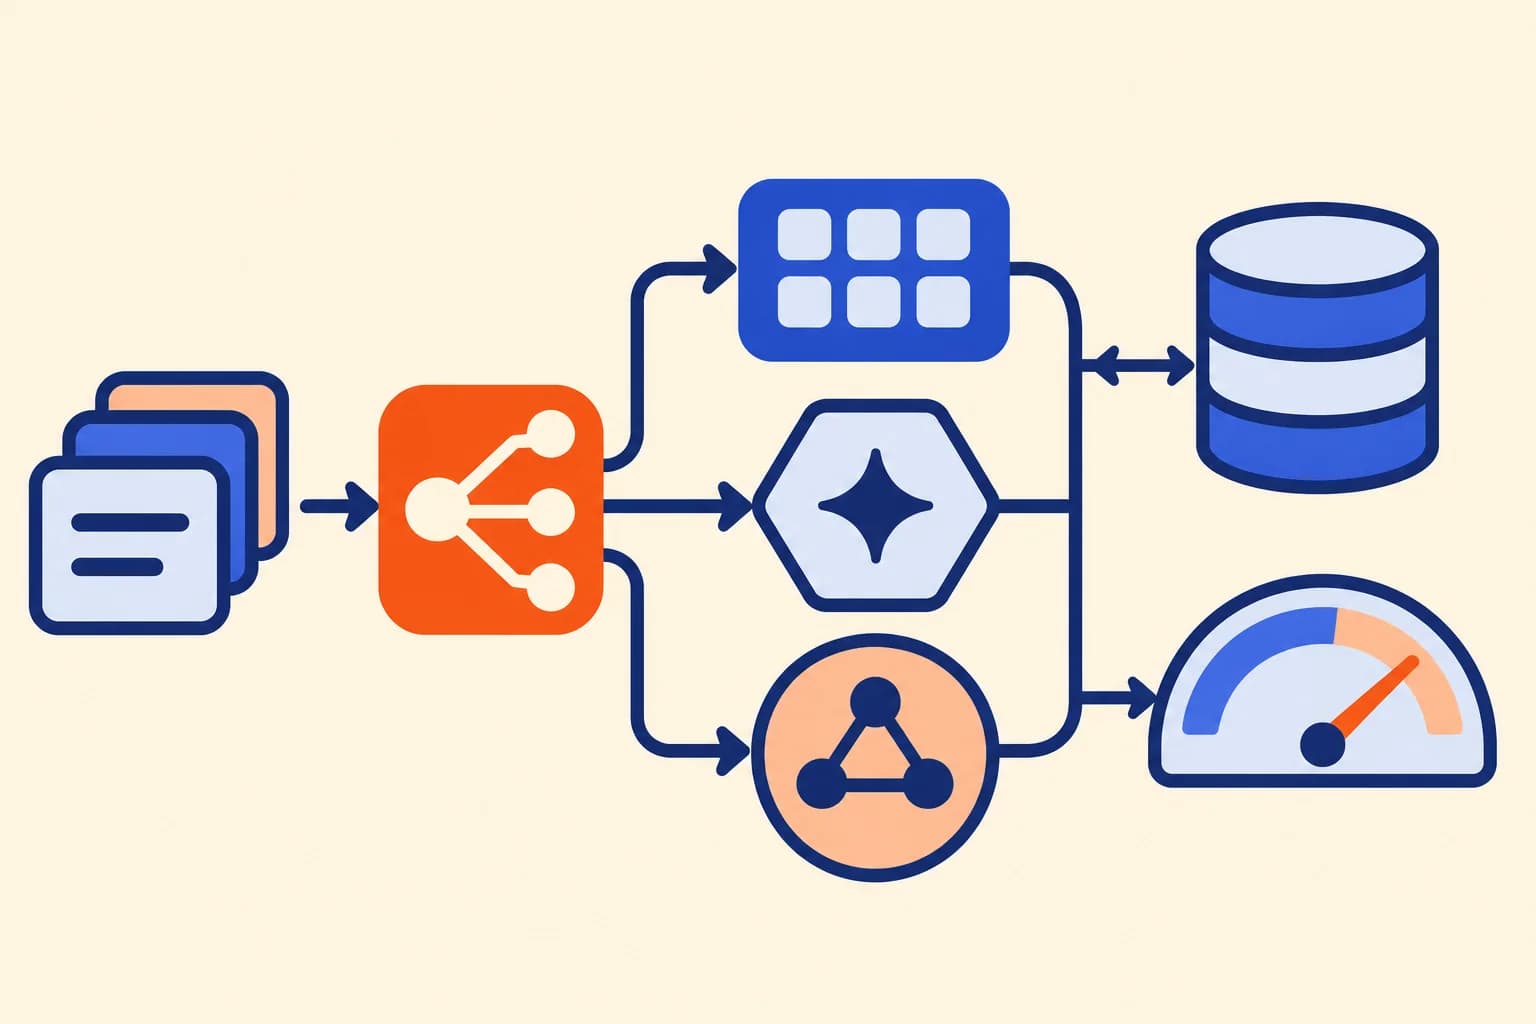
Before opening a dashboard, we extract date, host, path, user agent, HTTP status, response time, and resource type. We identify bots with explicit rules and distinguish HTML, images, and other resources. We also check for duplicates, ingestion gaps, and retention: a clean chart can hide incomplete data.
Questions that can be answered
How many requests for HTML pages did each section receive? Did 404 or 5xx responses rise after a release? Is Googlebot following a redirect chain? Which valuable URLs did it not visit in the period analyzed? What activity do AI bots show? Logs quantify those observations; on their own they do not explain the cause or guarantee a search ranking.
Combine logs with other data
Reading improves when logs are cross-referenced with sitemaps, Search Console, the CMS inventory, and your own crawls. The same URL can have different impressions, crawling, and canonical. The dashboard should allow moving from the overall trend to a specific URL and preserve the time context of each source.
The goal is for SEO and engineering to share an operational signal and verify whether a fix produced the expected behavior.